
Access to this content requires acceptance of our Data Use & Privacy Policy.
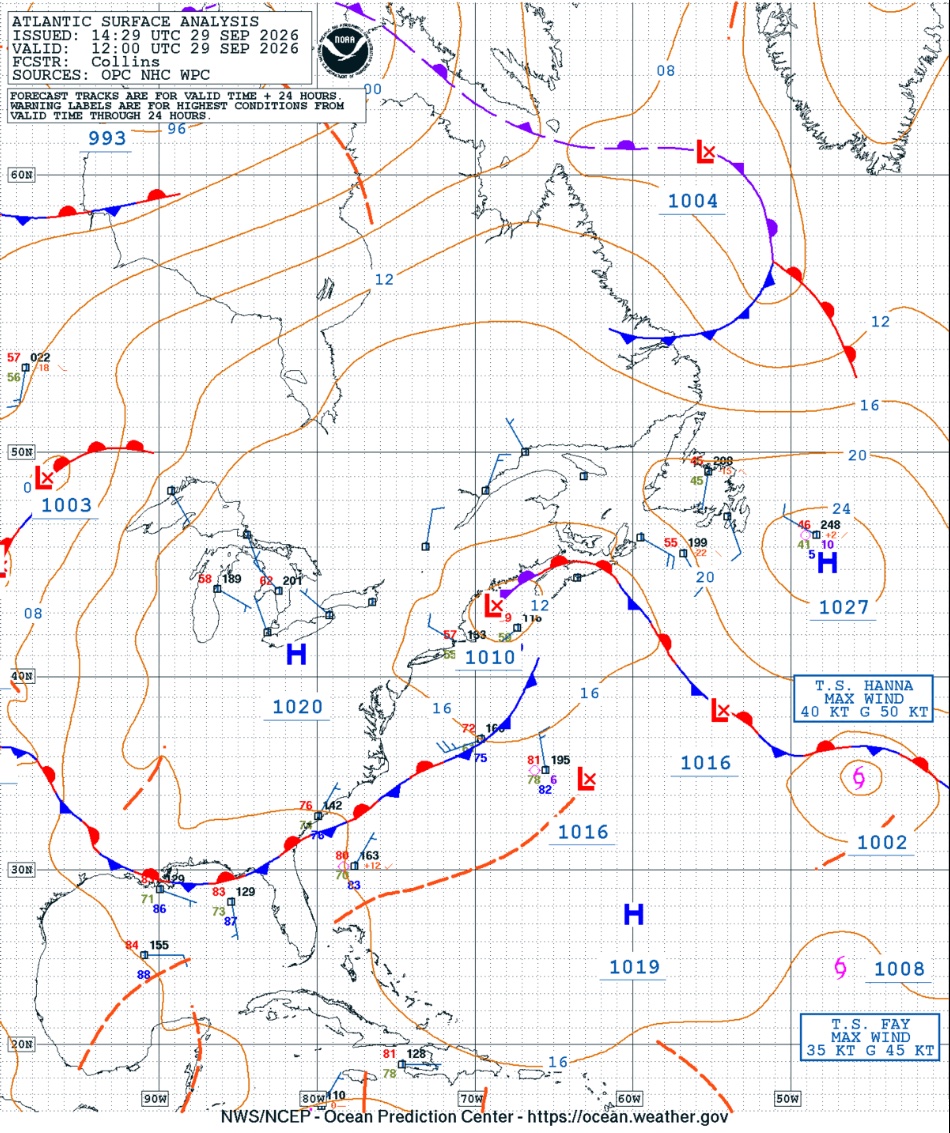
The historic early-season nor’easter of 25-29 September 2026 caused major impacts over the northeastern U.S. coastal areas including very high rainfall amounts, strong winds, power outages, and coastal flooding and erosion. During that time, the storm developed off the coast of North Carolina and moved northward, reaching just south of Long Island on the morning of the 27th as it grew dramatically in size, building the fetch of mostly northeasterly winds over the ocean. Prevented on that day from moving further north by strong high pressure in Canada, the storm turned westward on the 27th and then southwestward over coastal New Jersey through the 28th before looping back to the northeast as it began to weaken, drifting across southeastern New England on the morning of the 29th, and moving offshore and out of the area early on the 30th.
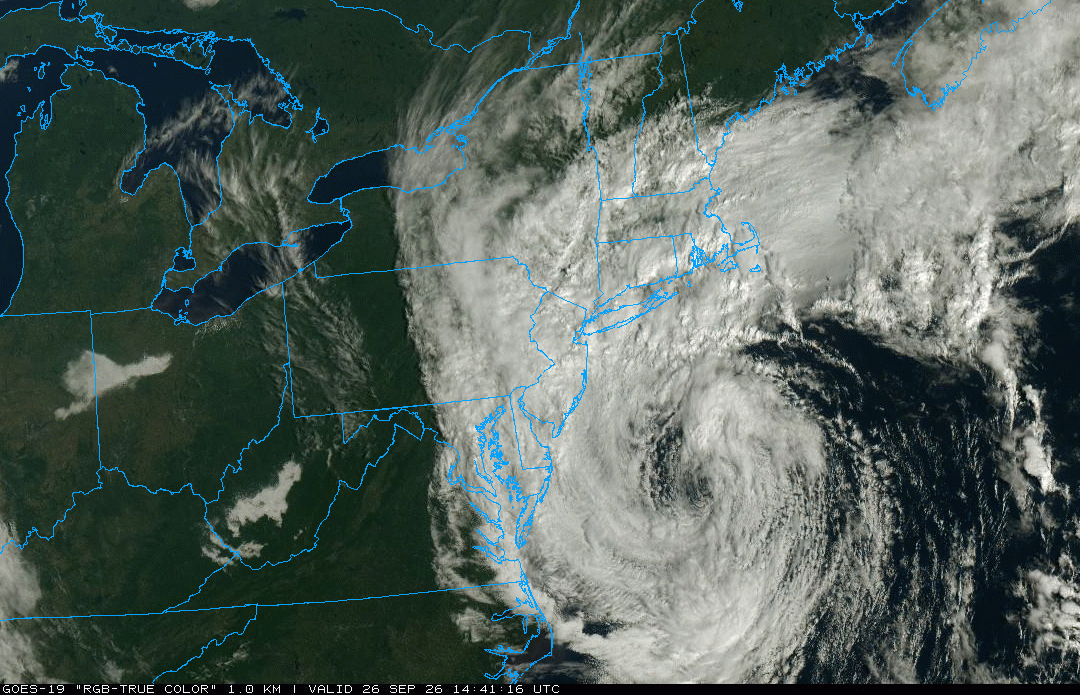
Visible satellite imagery of the intensifying major nor’easter off the mid-Atlantic coast moving northward toward New England on the morning of 26 September 2026. GOES-19 image courtesy of College of DuPage (weather.cod.edu).
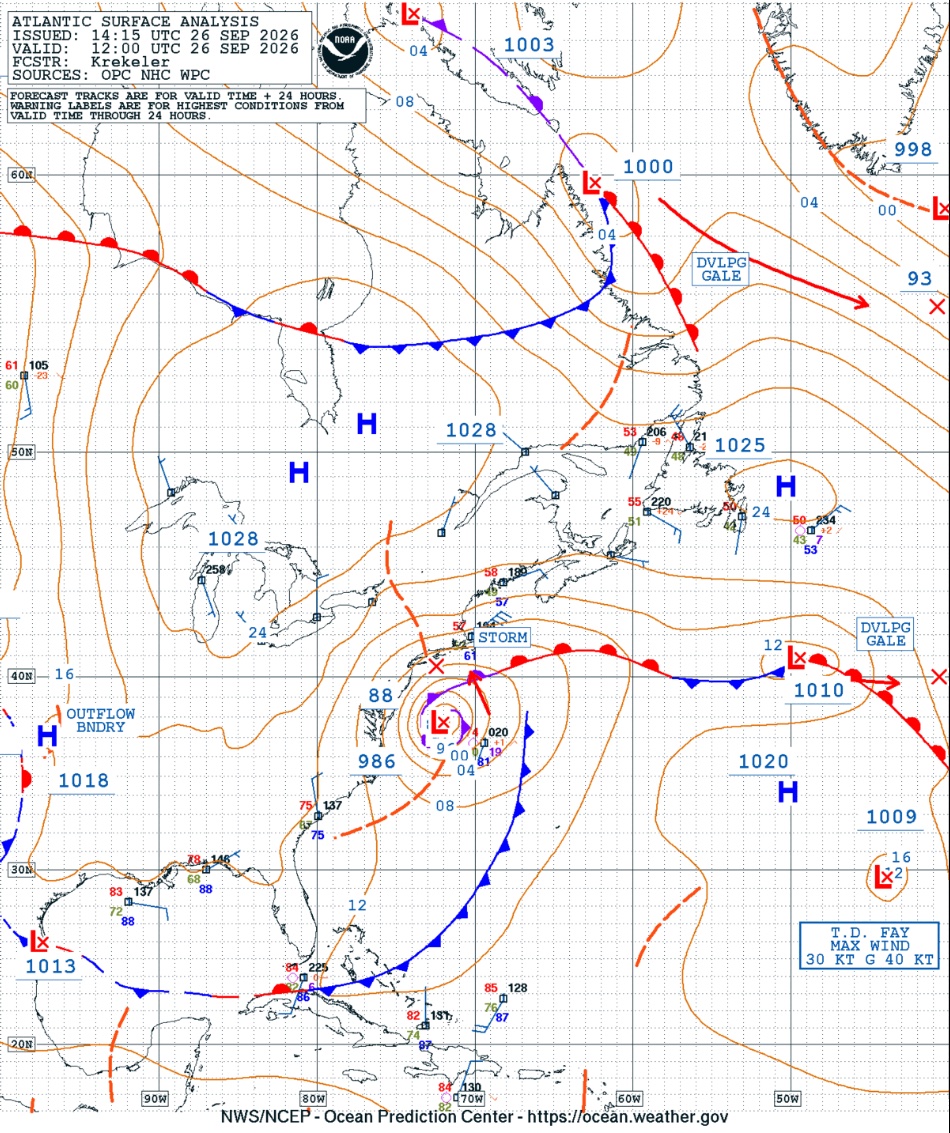
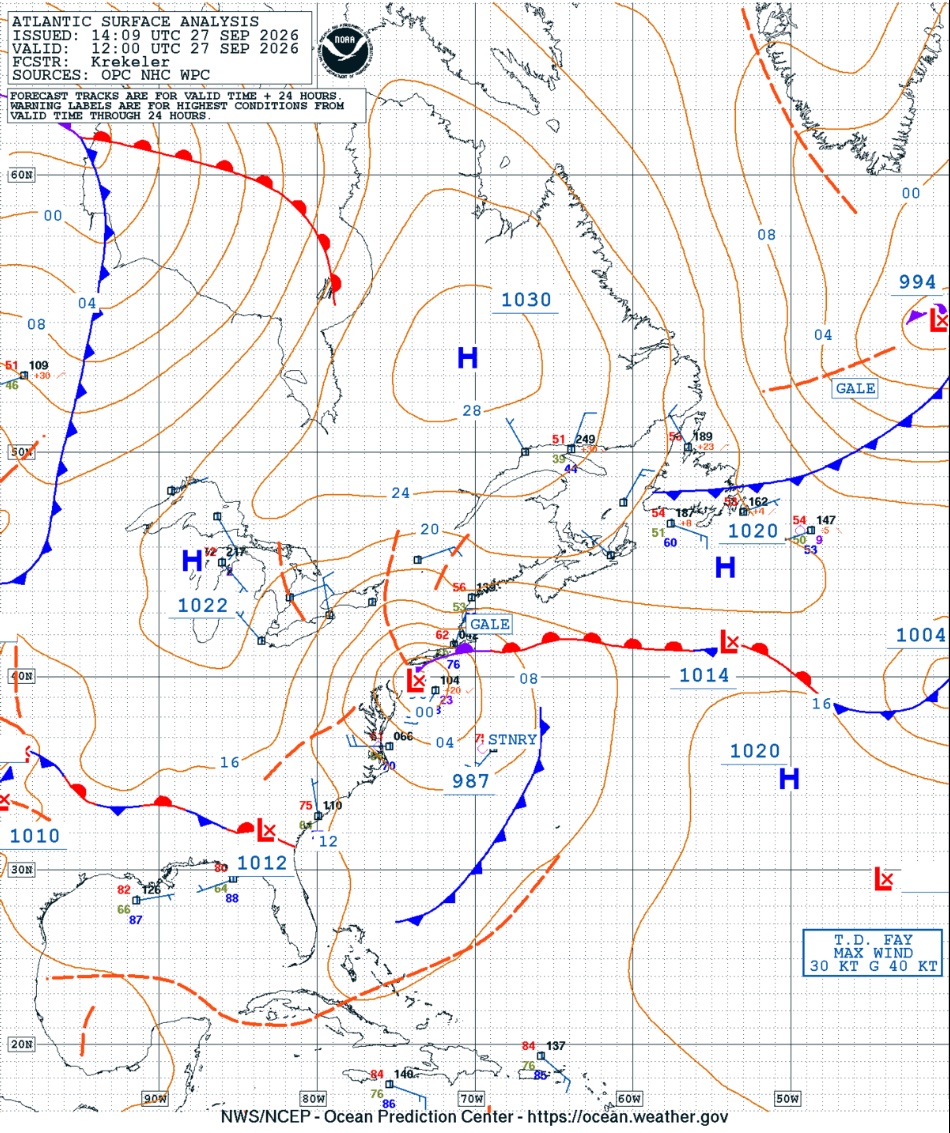
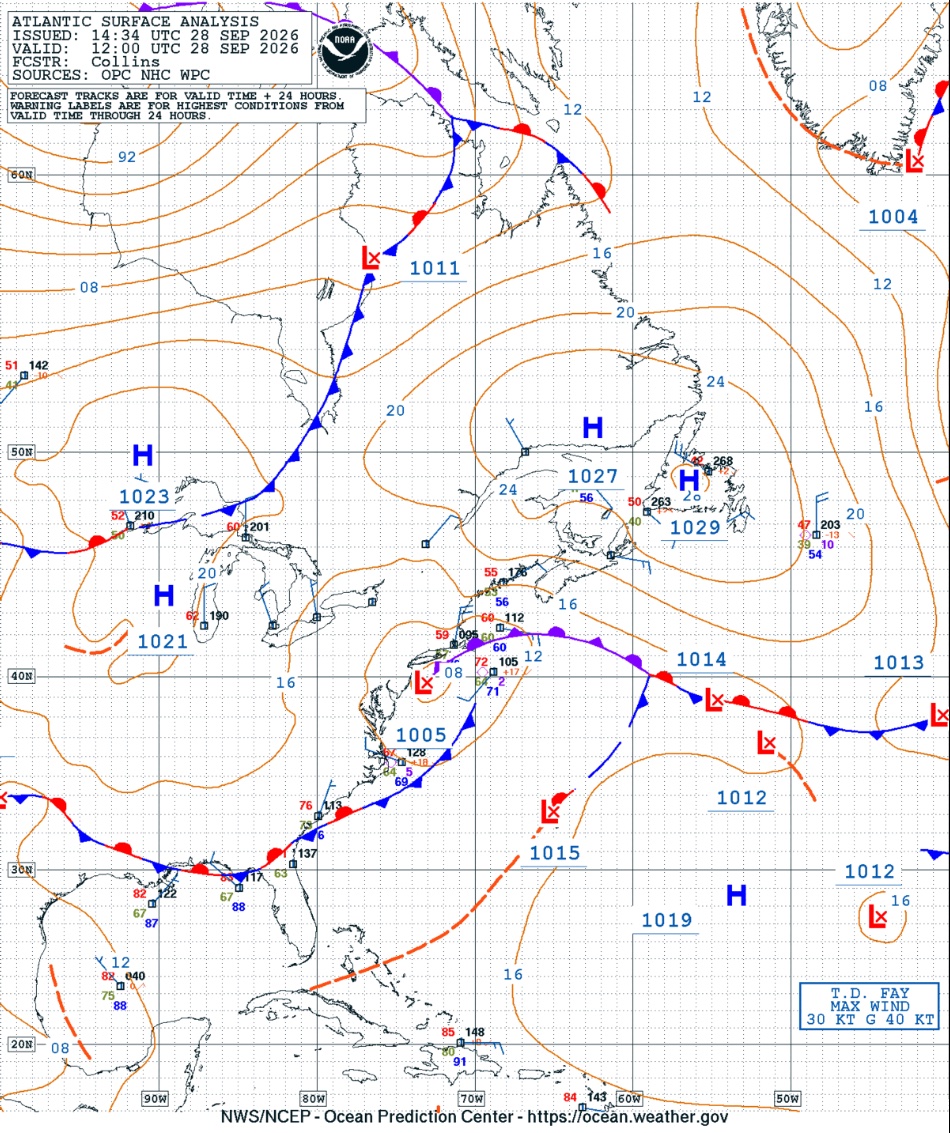
Western Atlantic surface maps showing the position of the September 2026 nor’easter at 12 UTC (7 AM EST) on 26, 27, 28, and 29 September 2026. Maps courtesy of the NOAA Ocean Prediction Center (ocean.weather.gov).
There were 86 consecutive hours with a trace or more of precipitation at Blue Hill from the evening of September 25th to the morning of the 29th. All of the precipitation fell in the form of rain, and the storm total precipitation was an astounding 9.23 inches. This amount was the greatest single storm precipitation total during September in the history of the Observatory, and it was the third greatest storm total for any month of the year. The greatest in any 24-hour period was 6.53 inches from 1 PM EST on the 26th to 1 PM the 27th, which was also the highest ever observed in September and the fourth highest for any month. The wettest calendar day was the 27th when 5.15 inches of rain was observed, which was the fifth greatest calendar day rainfall on record during September easily surpassing the previous record for the date of 2.26 inches set in 1962. The second wettest day was the 26th when 3.35 inches was observed. Nine hours during the storm met the criteria for heavy rainfall (0.31 inches or more over 60 minutes) including two hours on the 26th and seven hours on the 27th, though heavy rainfall rates were observed for shorter periods during several other hours. The heaviest rainfall in a single hour was 0.92 inches from 8-9 AM EST on the 27th. The storm raised the monthly precipitation total for September 2026 to 11.53 inches, and the month was the second wettest September on record.
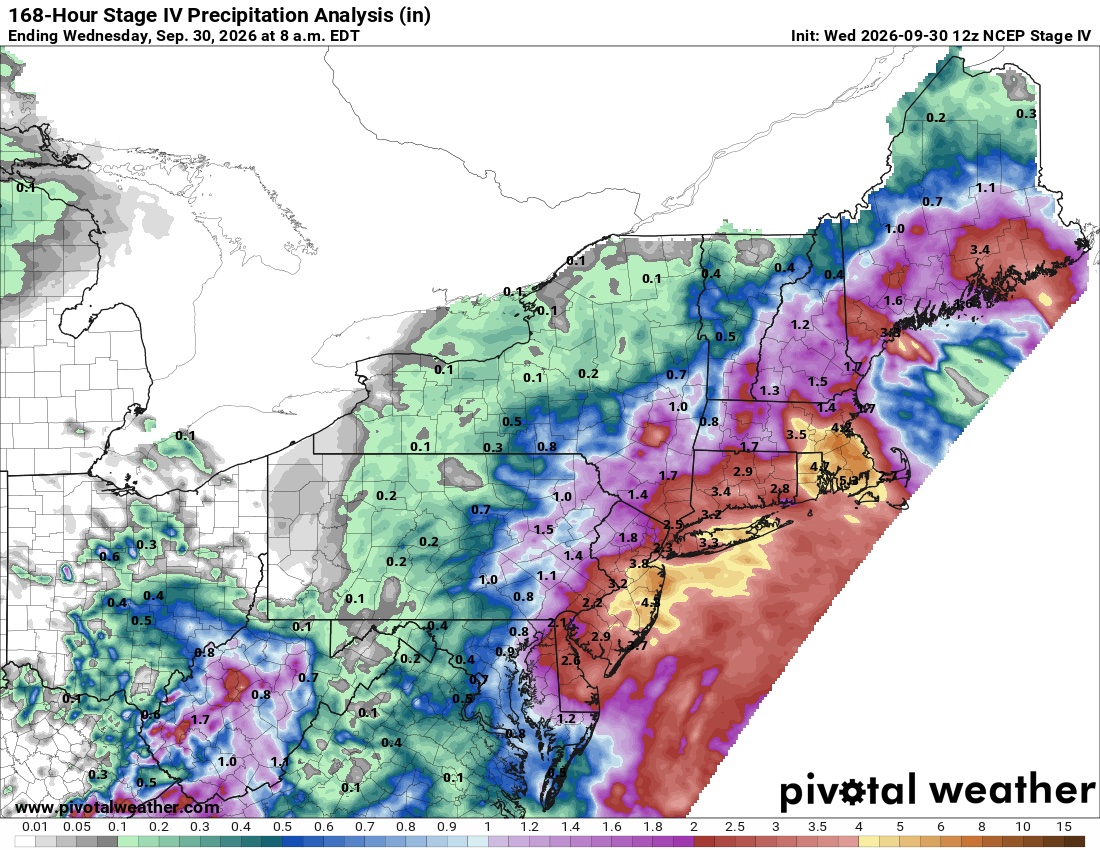
Seven-day total precipitation analysis for the period ending at 7 AM EST on 30 September 2026 showing a depiction of the storm total rainfall over the mid-Atlantic and New England from the September 2026 nor’easter. Graphic courtesy of Pivotal Weather (pivotalweather.com).
Air temperatures during the nor’easter remained in the 50’s for much of the event, not reaching the low 60’s until drizzle and very light rain were occurring during the afternoon of the 29th. The strongest winds were observed in the later afternoon and evening of the 26th as the storm approached from the south with a peak gust of 58 mph from the NE at 4:12 PM EST on that day. The highest hourly average wind speed was 28 mph from 7-8 PM EST on the 26th. Strong winds continued into the 27th, and the peak gust on that date was 52 mph from the NE at 1:23 AM EST. Wind speeds then gradually decreased with a peak gust of 36 mph from the NNE on the 28th and 20 mph from the NNW on the 29th. While the minimum central surface pressure of the nor’easter was relatively low for an ocean storm at this time of year, the storm had weakened by the time it crossed over southern New England and so surface pressures over land were not unusually low. The minimum sea-level pressure recorded at the Observatory during the storm was 29.75 inches on the morning of the 27th during the storm’s initial approach to New England. Low clouds were a dominant feature of the skies throughout the nor’easter, and no bright sunshine was observed for four days from the 25th to the 28th with only six minutes on the 29th.
BHO Wettest September Calendar Days, inches (1886-2026):
1) 5.60 on 10 Sep 1999
2) 5.58 on 21 Sep 1961 (Hurricane Esther)
3) 5.23 on 11 Sep 1954 (Hurricane Edna)
4) 5.18 on 10 Sep 1924
5) 5.15 on 27 Sep 2026 (Nor’easter)
6) 5.12 on 16 Sep 1933 (Hurricane)
7) 4.57 on 20 Sep 1899
8) 4.25 on 18 Sep 1996 (Nor’easter)
BHO Highest September Precipitation, inches (1886-2026):
1) 12.37 in 1999
2) 11.53 in 2026
3) 11.04 in 1933
4) 10.23 in 1896
5) 10.00 in 1961
6) 9.62 in 1987
7) 9.58 in 1888
8) 9.36 in 1918
9) 9.25 in 2018
10) 8.81 in 1907
BHO Highest Storm Total Precipitation, inches (1886-2026):
1) 12.77 on 18-19 Aug 1955 (Tropical Storm Diane)
2) 9.41 on 13-15 Mar 2010 (Nor’easter)
3) 9.23 on 25-29 Sep 2026 (Nor’easter)
4) 8.67 on 5-7 Oct 1962 (Nor’easter)
5) 8.47 on 19-21 Oct 1996 (Nor’easter)
6) 7.93 on 4-8 Jun 1982 (Nor’easter)
7) 7.89 on 15-17 Sep 1933 (Hurricane)
8) 7.75 on 17-20 Mar 1968 (Nor’easter)
BHO Highest 24-Hour Precipitation, inches (1886-2026):
1) 9.93 on 18-19 Aug 1955 (Tropical Storm Diane)
2) 7.41 on 20-21 Oct 1996 (Nor’easter)
3) 6.62 on 17-18 March 1968 (Nor’easter)
4) 6.53 on 26-27 Sep 2026 (Nor’easter)
5) 6.23 on 14-15 Oct 2005 (Nor’easter)
Mike Iacono
Chief Scientist
Blue Hill Observatory


