
Access to this content requires acceptance of our Data Use & Privacy Policy.
Blue Hill Observatory September 2026 Summary:
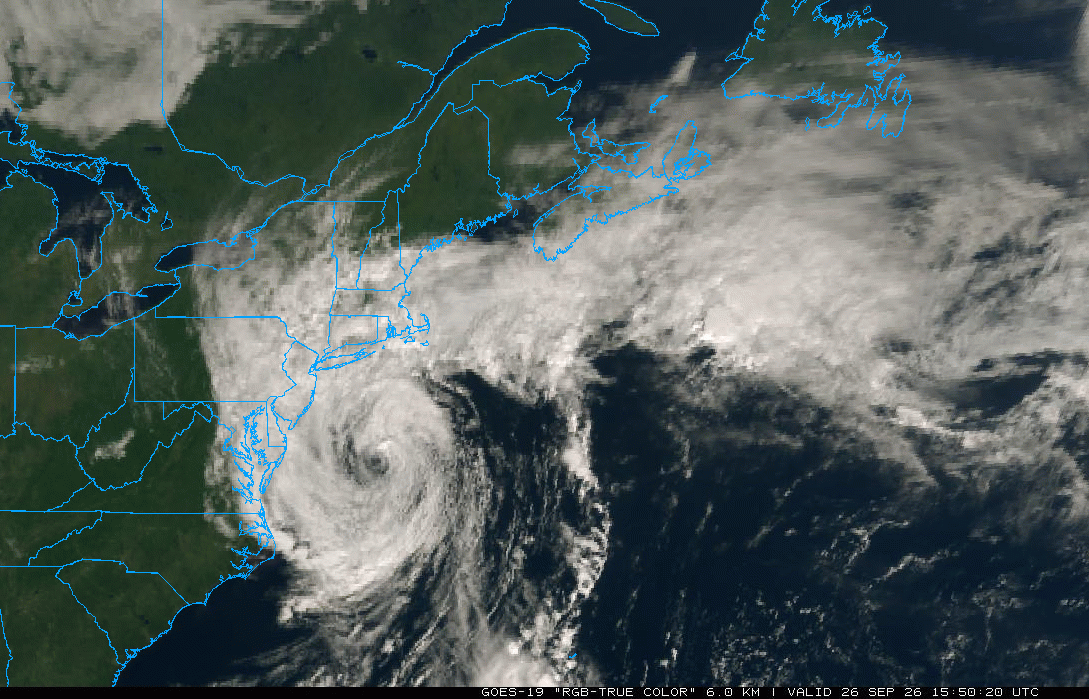
September 2026 was exceptionally wet due to a single major rain storm and had much less sunshine than expected. The approximated 24-hour mean temperature for the month of 62.2 deg F was 0.7 degrees warmer than the 1891-2020 130-year average for September, but it was 0.9 degrees cooler than the 1991-2020 30-year average. The average maximum temperature of 70.1 deg F was 2.6 degrees colder than the 30-year normal, and the average minimum temperature of 54.9 deg F was 0.7 degrees cooler than the 30-year normal. Only nine days averaged warmer than normal. The highest temperature was 84F on the 4th and 10th, and the lowest temperature was 46F on the 24th. September mean water vapor pressure, which is an absolute measure of water vapor in the air, was 15.5 mb, which corresponded to a mean dew point of about 56F. This amount was slightly above the long-term mean water vapor pressure for September of 14.8 mb, which equals a mean dew point of about 55F. After a prolonged period of dry weather this year, the big story during September was a major nor’easter late in the month that brought excessive precipitation and strong winds over several days erasing most of the annual rainfall deficit. September ended as the second wettest on record with a total precipitation of 11.53 inches, which was 7.47 inches more than the 30-year normal. Most of the monthly total was observed during the nor’easter on the 25th-29th, which brought an astounding storm total of 9.23 inches. This amount was the greatest storm total precipitation ever measured in September at the Observatory, and it was the third largest on record for any month over the last 140 years. The greatest amount in 24 hours was 6.53 inches on the 26th-27th, which was the highest 24-hour rainfall on record for September and the fourth highest for any time of year. The wettest calendar days were the 27th with 5.15 inches, which was the fifth wettest calendar day in September, and 3.35 inches on the 26th. The highest hourly rainfall was 0.92 inches during a full hour of heavy rain on the morning of the 27th. There were no thunderstorm days during the month, which was two fewer than average. The highest sea-level pressure was 30.58 inches on the 23rd, and the lowest sea-level pressure was 29.75 inches during the nor’easter on the 27th. The monthly mean wind speed was 11.0 mph, and the prevailing wind direction was from the northeast. The highest wind gust was 58 mph from the northeast during the storm on the 27th. September sunshine was much below average with 176.3 hours of bright sunshine, or 49 percent of possible, which was eight percent less than the long-term average for the month.
BHO Highest September Precipitation, inches (1886-2026):
1) 12.37 in 1999
2) 11.53 in 2026
3) 11.04 in 1933
4) 10.23 in 1896
5) 10.00 in 1961
6) 9.62 in 1987
7) 9.58 in 1888
8) 9.36 in 1918
9) 9.25 in 2018
10) 8.81 in 1907
BHO Wettest September Calendar Days, inches (1886-2026):
1) 5.60 on 10 Sep 1999
2) 5.58 on 21 Sep 1961
3) 5.23 on 11 Sep 1954
4) 5.18 on 10 Sep 1924
5) 5.15 on 27 Sep 2026
6) 5.12 on 16 Sep 1933
7) 4.57 on 20 Sep 1899
8) 4.25 on 18 Sep 1996
BHO Highest Storm Total Precipitation, inches (1886-2026):
1) 12.77 on 18-19 Aug 1955
2) 9.41 on 13-15 Mar 2010
3) 9.23 on 25-29 Sep 2026
4) 8.67 on 5-7 Oct 1962
5) 8.47 on 19-21 Oct 1996
6) 7.93 on 4-8 Jun 1982
7) 7.89 on 15-17 Sep 1933
8) 7.75 on 17-20 Mar 1968
BHO Highest 24-Hour Precipitation, inches (1886-2026):
1) 9.93 on 18-19 Aug 1955
2) 7.41 on 20-21 Oct 1996
3) 6.62 on 17-18 Mar 1968
4) 6.53 on 26-27 Sep 2026
5) 6.23 on 14-15 Oct 2005
Mike Iacono
Chief Scientist
Blue Hill Observatory


