
Blue Hill Meteorological Observatory Climate Data
Extensive work is in progress to transfer over 135 years of primary daily data observations including maximum and minimum temperature, precipitation, snowfall, snow cover, wind speed, sunshine and other parameters. This process will fill gaps and remove inconsistencies in the existing database and begin the process of digitizing data that has never been tabulated before. The objective is to generate the best possible collection of BHO daily climate data to support ongoing and future climate research projects. All data files require acceptance of the Observatory's Data Use & Privacy Policy prior to download. Expanded member files with longer historical records are also available below. As additional datasets are processed, they will be made available to Observatory members or researchers here or on request.
Temperature
 Hazen Temperature Shelter
The daily highest and lowest extreme temperatures are recorded at Blue Hill every day using two different thermometers in the white, shuttered Hazen temperature shelter within the instrument enclosure on the summit to the northeast of the Observatory. The maximum thermometer uses mercury in glass with a small constriction that allows the mercury to rise with the temperature, but prevents it from dropping until it is manually reset. The minimum thermometer contains an alcohol-based fluid that contains a floating index that drops with the temperature and marks the lowest temperature reached until the index is reset. The shelter also contains a psychrometer for measuring the current dry bulb and wet bulb temperatures that are used to derive the dew point and relative humidity. Hourly temperatures for every day are derived from a thermograph chart recorder also in the shelter using the manually observed temperatures as reference data points.
Samples of the daily temperature data for the years 2010–2021 are provided below in the form of Excel spreadsheets, which contain the recorded maximum and minimum temperatures for each day in each month of the year.
Precipitation
 Manual Weighing Rain Gauge, Snow Board, Ombroscope, and Standard 8-inch Rain Gauge (left to right)
Precipitation is recorded daily using a variety of equipment in the outdoor instrument enclosure near the Observatory. Manual readings of precipitation at three, six and 24-hour intervals are obtained by inserting a measuring stick into the standard 8-inch rain gauge, which is surrounded by metal slats to protect the falling precipitation from being blown away from the gauge by strong winds. Hourly precipitation is derived from the continuous chart recording of precipitation attached to the weighing rain gauge and by calibrating the amounts to those recorded in the standard gauge. The beginning and ending time of precipitation is recorded by an ombroscope, which consists of a chart-covered, clock-driven rotating cylinder inside the metal case that positions a small opening directly over the water-sensitive chart. Snowfall amounts are derived as an average measurement from several locations including on the white snow board (one of two in the enclosure).
Samples of the daily precipitation and snowfall data for the years 2010–2021 are provided below, containing the recorded liquid equivalent precipitation (including rain and melted snow and sleet) and the measured frozen precipitation for each day in each month of the year.
Bright Sunshine Duration
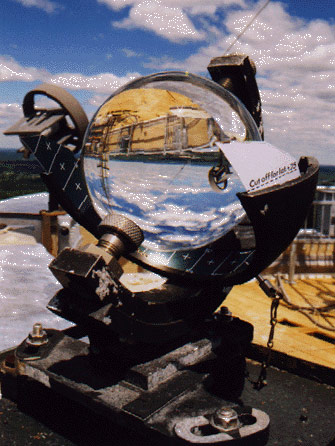 Campbell-Stokes Sunshine Recorder
A Campbell-Stokes sunshine recorder has been in use to measure bright sunshine duration at BHO since 1886, representing the longest such record of sunshine in North America. The parameter is referred to as bright sunshine since sunlight must be of sufficient intensity to scorch a paper card placed under the glass sphere to record the daily duration of sunshine. The recently tabulated daily sunshine data have been studied to assess the presence of climate change signals, and a paper based on this work has been published in the Bulletin of the American Meteorological Society.
A sample of the daily sunshine data for the years 2010–2021 is provided below, containing for each month of the year the recorded sunshine hours, minutes and percent of possible for each day.
Monthly Means and Extremes
Click here to see the complete list of monthly means for the 130-year period 1891–2020 and monthly extremes for the full period of record for temperature, precipitation, snowfall, and wind.
Climate Data Graphics
Click here to see plots of the Blue Hill climate data for the full period of record for temperature, precipitation, snowfall, wind speed, sunshine, and other parameters.


