Graphs of Annual Blue Hill Observatory Climate Data
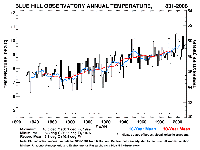
Weather observations on Blue Hill began on February 1, 1885, but the annual mean temperature plot below includes data for 1831 to 1884 from nearby locations that have been carefully adjusted to the Great Blue Hill summit, to extend the Observatory mean temperature record back to 1831.
Long-Term Climate Graphs
 Annual Mean Temperature (since 1831)
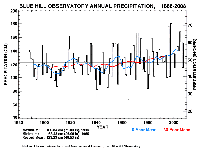
 Annual Precipitation (since 1886)
 Seasonal Snowfall (since 1885-1886)
 Annual Mean Wind Speed (since 1885)
 Annual Mean Bright Sunshine (since 1886)
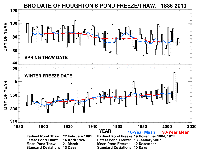
 Houghton’s Pond Freeze/Thaw Dates (since 1886)
 Date of First Ripe Blueberries (since 1886)


