
2024 Summary – Tied for Third Warmest on Record
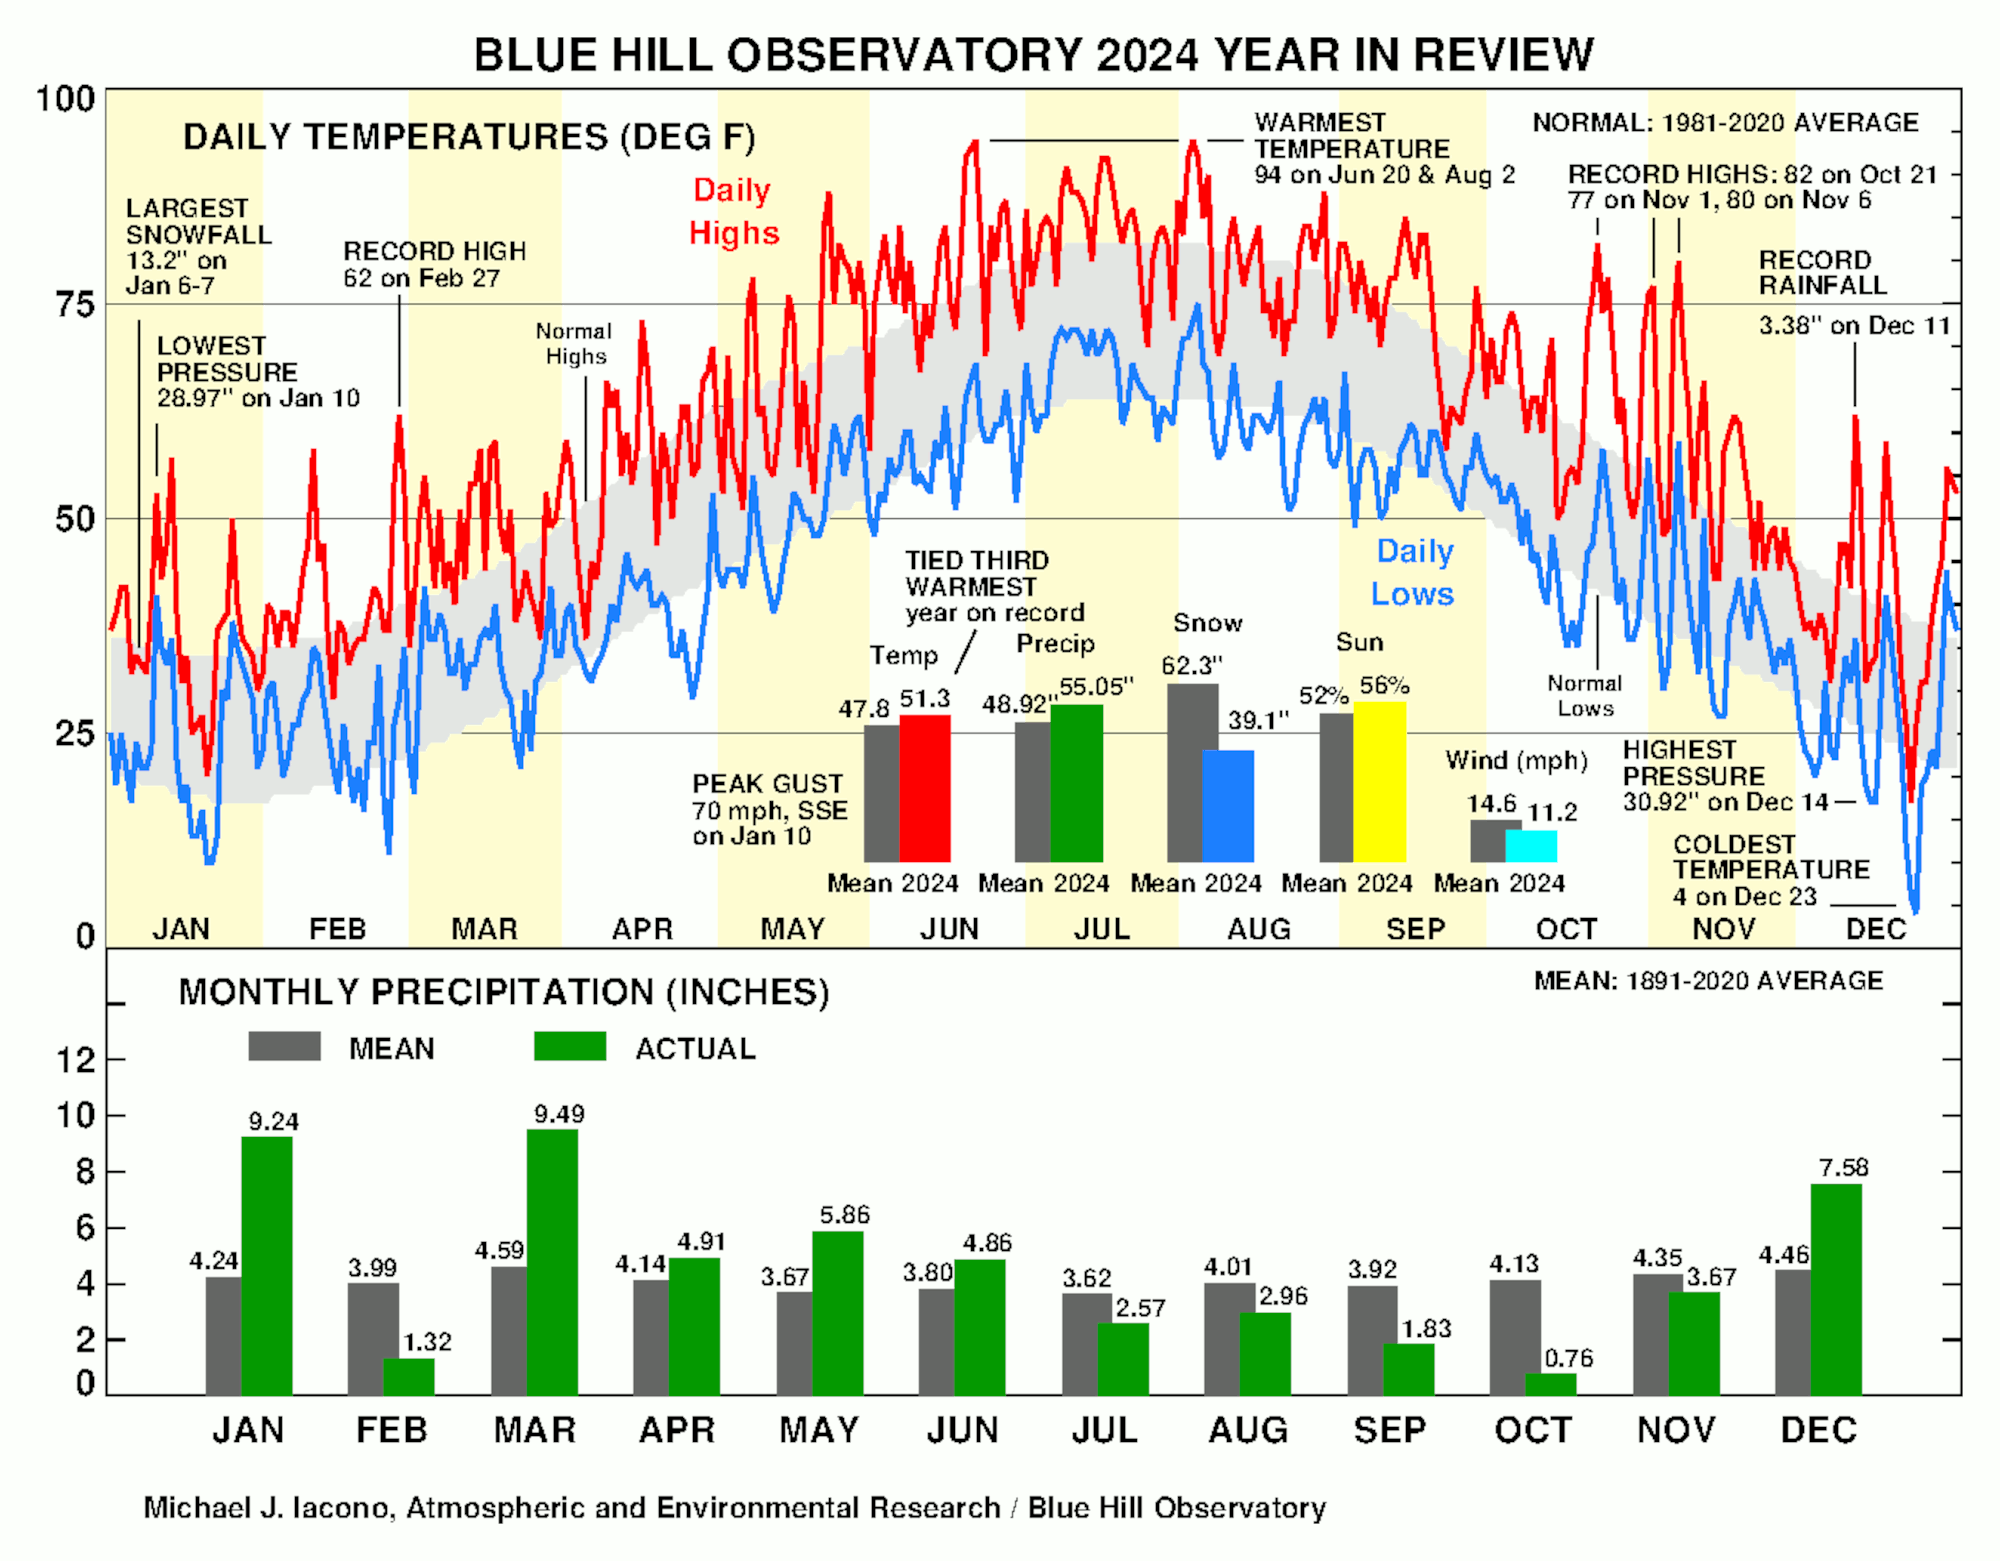
The year 2024 was exceptionally warm and tied as the third warmest on record. The approximated 24-hour mean temperature of 51.3F was 3.5F warmer than the 130-year (1891-2020) long-term mean and 1.8F above the 30-year (1991-2020) average. All twelve months were warmer than the long-term mean. The annual average maximum temperature of 60.5F, which tied as the fifth warmest on record, was 2.2F warmer than the 30-year normal. The annual average minimum temperature of 43.5F was 2.4F warmer than the 30-year normal, and it was the third warmest on record. Each of the last five years was among the nine warmest years on record, and the ten warmest years since 1885 have all occurred since 1998.
The year started warm and wet, and winter 2023-2024 tied as the tenth warmest on record. Three days had high temperatures of 50F or above during January, and twenty days were warmer than the 30-year normal with only one cold period just after the middle of the month. February also featured generally warm weather with twenty days warmer than normal including a daily record high of 62F on February 27th. The warmth continued in March with especially high daily minimum temperatures; twenty-four days were warmer than normal though the highest for the month was only 59F. April and May were mild with few temperature extremes, and the spring season (March-May) tied as the tenth warmest on record. Very warm weather returned in June, and the first heat-wave of the year occurred on June 18th-20th with highs of 92F, 93F, and 94F, which was only the fourteenth heatwave in June on record at the Observatory. July was warm with 16 consecutive days from the 7th-22nd having highs of 80F and above. August began warm with the second heat-wave of the year, which brought highs of 92F, 94F, and 92F on the 1st-3rd, and the month was cooler after the last reading of 90F of the year on August 5th. The highest temperature for the year was the pair of 94F readings during the heat-waves in June and August. Summer 2024 was the seventh warmest on record. Seasonable temperatures were observed through September into mid-October. Several very warm periods were observed from October 19th into early November with eleven days reaching 70F or better during this time including record highs of 82F on October 21st and 80F on November 6th, which was the latest temperature of 80F on record at Blue Hill. Fall 2024 was the fifth warmest on record. December brought large swings in temperature, though there were no daily records. The highest temperature was 62F during a warm rain and wind storm on the 11th, and the lowest temperature was 4F on December 23rd, which was also the coldest temperature for the year.
Ponkapoag Pond and Houghton’s Pond were first considered frozen for the 2023-2024 winter season on 9 January 2024, one of the latest dates on record, and both ponds were considered thawed for that season on February 26th. The freeze interval during that season of only 48 days was about half of the long-term average, which is consistent with the long-term trend toward shorter periods of ice covered ponds during winter. At the start of the 2024-2025 winter season, Ponkapoag first froze on 3 December 2024 and Houghton’s first froze on 15 December 2024. Both ponds were briefly thawed on December 18th-21st before fully freezing again on December 23rd.
The annual rainfall of 55.05 inches was over six inches more than the 130-year average and 1.19 inches more than the 30-year normal. A very wet January started the year with sixteen days having measurable precipitation including eight days in a row on the 23rd-30th. The largest January storms included 1.67 inches of liquid equivalent and 13.2 inches of snow on January 6th-7th, 2.88 inches of mostly rain with 0.4 inches of snow on the 9th-10th, which included strong winds to 70 mph from the south-southeast on the 10th, and 1.72 inches of rain on the 13th. February was very dry with only 1.32 inches of rain and melted snow. Very wet weather returned in March, the wettest month of the year, with a total of 9.49 inches, including 2.49 inches of rain with several hours of occasional heavy rain and gusty winds on the 23rd. Other notable storms in March brought 1.40 inches on the 2nd-3rd, 1.50 inches on the 6th-7th, and 2.32 inches of rain on the 27th-29th. The total rainfall for January to March was 20.05 inches, which was the sixth highest on record for those months. Precipitation from April to June was slightly above average, and the largest storm in this period brought 2.35 inches of rain with a small amount of sleet and snow and strong east to east-northeast winds on April 3rd-4th. A long period of relatively dry weather began in mid-July and lasted into mid-November, and only 6.08 inches of rain were observed from June 19th through November 20th. Much of eastern New England was in a state of extreme to severe drought during the fall months. The dry spell ended with a three-day rain storm that brought 2.53 inches on November 21st-23rd. Very wet weather continued into December with a total of 7.58 inches during that month, and a strong rain and wind storm brought a total of 3.44 inches on December 10th-12th, which included a calendar day record of 3.38 inches of rain and a thunderstorm on December 11th. There were 20 thunderstorm days during 2024, which was two fewer than average.
Annual snowfall totaled 39.1 inches, which was more than 30 inches less than the 30-year normal. More than half of the annual snowfall fell in January with a total of 20.6 inches, and much of that occurred during the largest snowfall of the year, which brought 13.2 inches on January 6th-7th. The deepest snow depth of the year was 11 inches following this storm on the morning of January 8th. The dry February included only 5.2 inches of snow. Only a trace of snow was observed in March, and 0.7 inches fell in April. The only other notable snowfall brought 9.4 inches on December 20th, which was most of the December snow total of 12.6 inches. Following that storm the coldest air of the year brought single digit low temperatures on December 22nd and 23rd. There were seven inches of snow on the ground on Christmas Day, which was the first “White Christmas” at Blue Hill since 2017. The long-term chance of a snow depth of one-inch or more on December 25th on the summit of Great Blue Hill is 44 percent.
The mean station pressure during 2024 at the elevation of the mercury barometer at the Observatory was 29.31 inches, which was 0.02 inches above the long-term annual mean of 29.29 inches. The maximum sea-level pressure during the year was 30.92 inches on December 14th, and the lowest sea-level pressure during 2024 was 28.97 inches during the strong rain and wind storm on January 10th.
One of the more unusual metrics recorded at the Observatory is the date of the first ripe blueberry on the summit of Great Blue Hill. In 2024 this was observed to occur on June 28th, which is about one week later than the long-term average date. In general, this date is trending earlier due to the warming climate.
Water vapor pressure, which is derived from the dew point and is an absolute measure of the amount of moisture in the air in terms of the pressure that water vapor contributes to the total surface pressure, averaged 11.0 mb (0.325 inches) during 2024. This value tied as the second highest on record and continued a trend of higher water vapor pressures in recent decades, which is consistent with the increasing trend in temperature. Another way to interpret this value is to state that water vapor on average comprised a little over one percent of the total annual mean station pressure during the year.
The annual mean wind speed of 11.2 mph was the second lowest on record for any year. This average continued the several decades long trend of decreasing mean wind speeds on Blue Hill. Two months during the year, August and September, set new record low average wind speeds. The prevailing wind direction for 2024 was west-northwest. The peak gust for the year was 70 mph from the south-southeast during the major rain and wind storm on January 10th. Other notable wind gusts during the year included 65 mph from the south-southwest on December 11th and 63 mph from the east-northeast on April 4th.
Bright sunshine for the year was 56 percent of possible, which was four percent more than the long-term average. The least sunny month was January with only 98.0 hours or 34 percent of the possible bright sunshine. The sunniest months during 2024 (relative to the possible sunshine) were October, which had 237.2 hours or 72 percent of the possible sunshine, and November, which had 204.7 hours of bright sunshine, which was 72 percent of possible for that month. The November sunshine was enough to make that month the sunniest November on record.
BHO Warmest Annual Approximated 24-Hour Mean Temperature, deg F (1885-2024):
1) 51.7 in 2012
2) 51.5 in 2023
3) 51.3 in 2020
51.3 in 2024
5) 51.2 in 2016
6) 51.1 in 2022
7) 51.0 in 2010
8) 50.9 in 1999
50.9 in 2021
BHO Warmest Annual Average Maximum Temperature, deg F (1885-2024):
1) 60.9 in 2022
2) 60.8 in 2012
3) 60.6 in 2016
60.6 in 2023
5) 60.5 in 1949
60.5 in 2024
7) 60.4 in 2020
8) 60.2 in 1999
BHO Warmest Annual Average Minimum Temperature, deg F (1885-2024):
1) 44.0 in 2012
2) 43.9 in 2023
3) 43.5 in 2024
4) 43.4 in 2020
5) 43.2 in 1998
6) 43.1 in 2021
43.1 in 2006
8) 43.0 in 2010
BHO Highest Annual Mean Water Vapor Pressure, mb (1932-2024):
1) 11.1 in 2023
2) 11.0 in 2012
11.0 in 2018
11.0 in 2024
5) 10.9 in 2011
10.9 in 2021
7) 10.8 in 2020
8) 10.7 in 1973
10.7 in 2022
BHO Lowest Annual Mean Wind Speed, mph (1885-2024):
1) 10.8 in 2023
2) 11.2 in 2024
3) 11.5 in 2021
4) 11.8 in 2012
5) 12.0 in 2020
12.0 in 2022
7) 12.1 in 2018
12.1 in 2019
Mike Iacono
Chief Scientist
Blue Hill Observatory


