| Temperature |
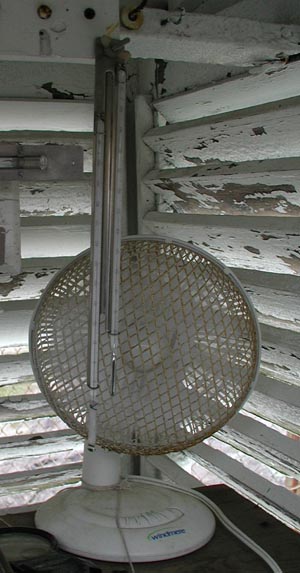
Wind |
Precipitation |
Pressure |
Sunshine, etc. |
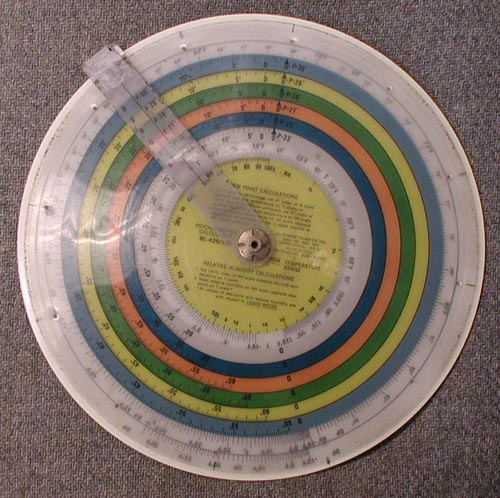
Psychrometer
|
Wind Gust Chart Recorder |
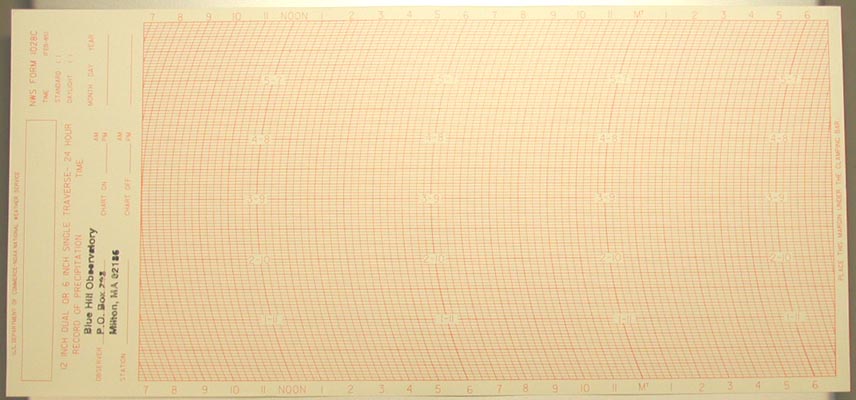
Standard Eight-Inch Rain Gage |
Mercury Barometer |
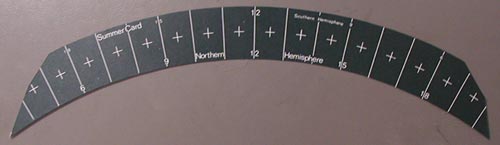
Sunshine Recorder |
| Maximum & Minimum Thermometers |
Wind Speed Chart Recorder |
Weighing Eight-Inch Rain Gage |
Microbarograph |
Visibility |
| Hygrothermograph |
Aerovane Wind Recorder |
Ombroscope |
Four-day Barograph |
ASOS
|
| Digital Thermometer (Nimbus) |
Maximum, Inc. Wind Recorder (Merlin) |
Digital Rain Gage Display (Nimbus) |
Digital Barometer (Nimbus) |
|
|
Maximum, Inc. Gust Recorder (Max #1) |
Snow Board |
NWS Aneroid Barometer |
|
|
Young Wind Display |
|
|
|
 Use:
Use: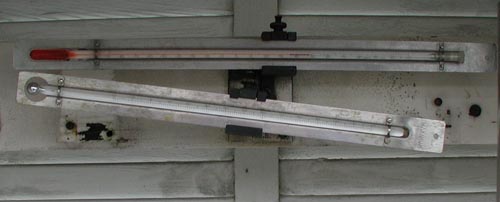 Use:
Use: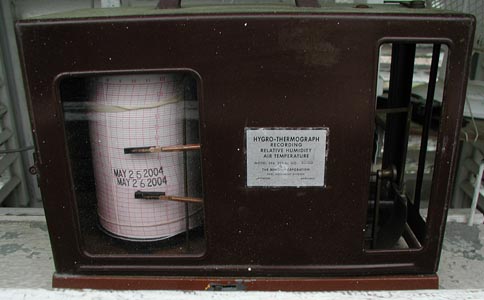 Use:
Use: Use:
Use: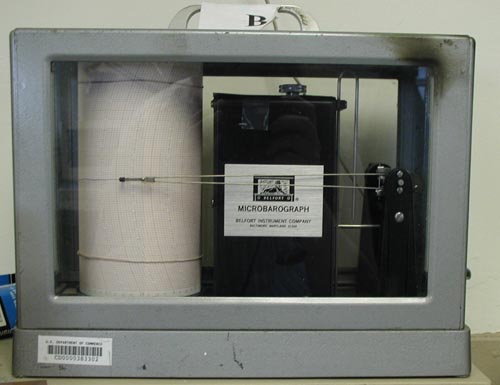 Use:
Use: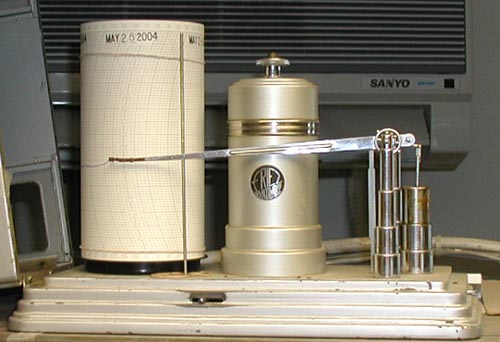 Use:
Use: Use:
Use: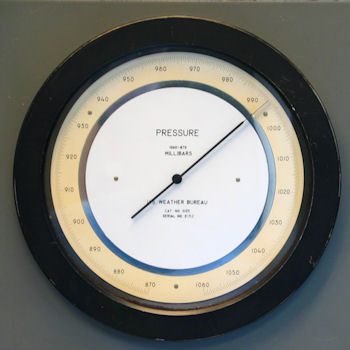 Use:
Use: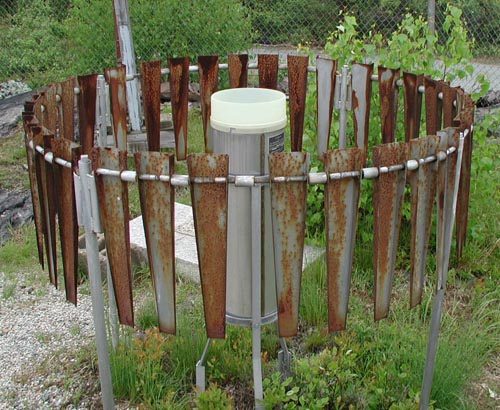 Use:
Use: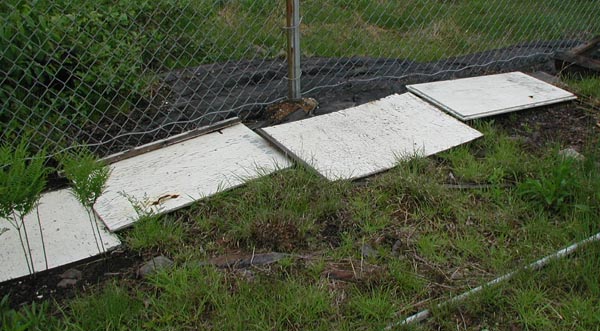 Use:
Use: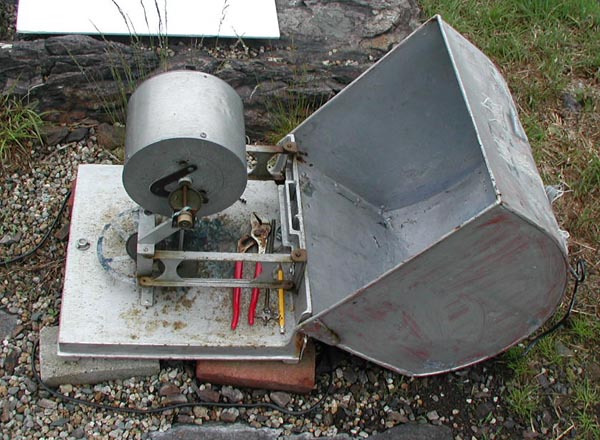 Use:
Use: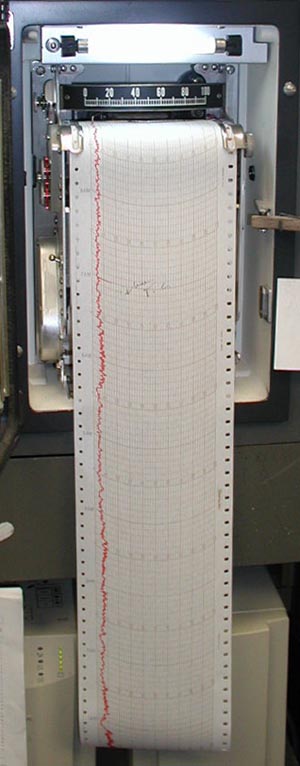 Use:
Use: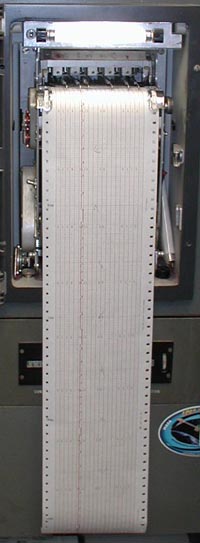 Use:
Use: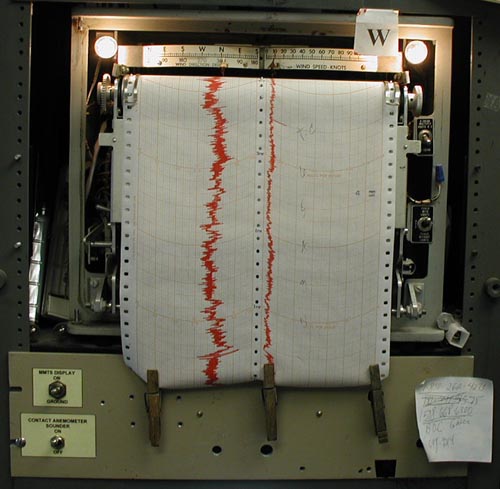 Use:
Use: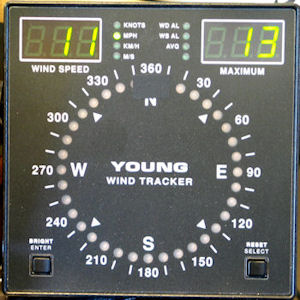 Use:
Use: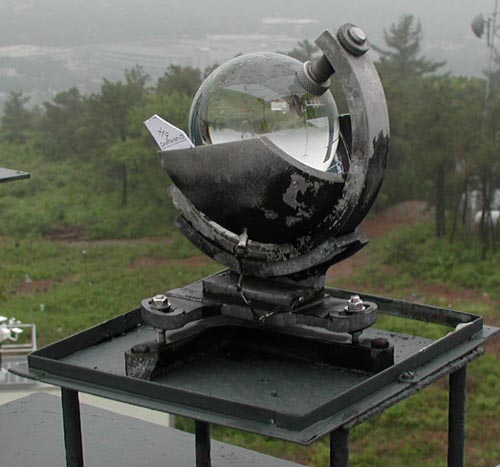 Use:
Use: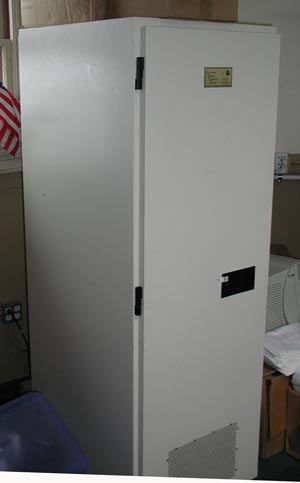 Use:
Use: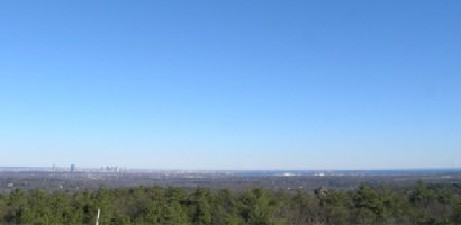 Use:
Use: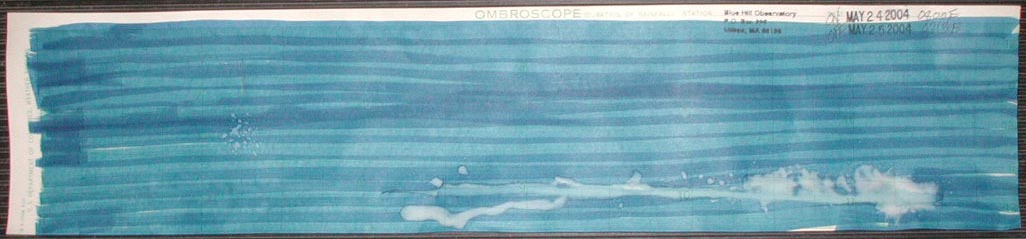
 Use:
Use: